


Exploring the top ways to improve your machine learning model - no-code needed.
In the era of Covid, you’ve probably grown tired of at-home DIY projects. If you’re using no-code machine learning without a data science team, data preparation and cleaning can be a solo project on your own.
We’re going to get crafty and really get into the ways you can make your machine learning model better inside Obviously AI—without a data science team.
In this post, we’ll cover:
- Identifying what success looks like
- Your data needs to be structured, not necessarily clean
- This is what a great dataset should look like
- How a Data Scientist is the best way to make your model better
Because we’re a no-code machine learning tool, we build algorithms for you in under a minute, so giving advice on building your model won’t make sense.
At the root of every machine learning algorithm, is the dataset. This is what we will be focusing on. We will cover everything from collecting data to what kind of datasets are best for making predictions.
Let’s begin.
Using Data to Solve Problems Begins With Asking a Question
Machine learning can identify patterns and relationships between data points and give you unparalleled insight into your customer’s behavior. But—there is a spectrum to how accurate your machine learning model can be.
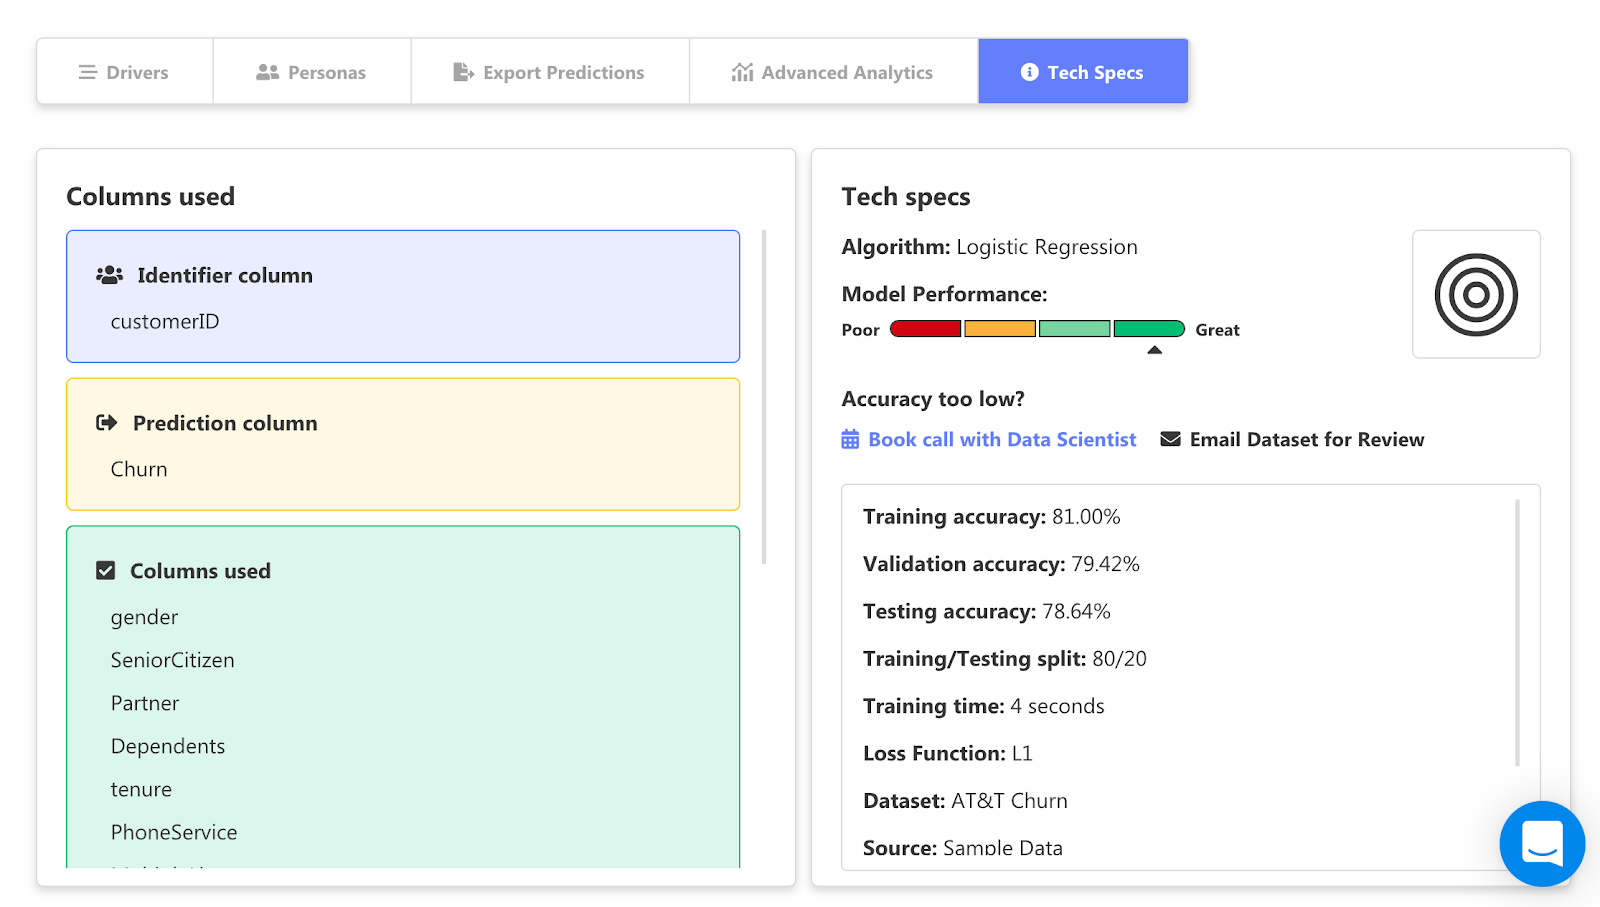
In the tech specs section of your prediction report, you can see the performance of your model, and the accuracy of the training, validation, and testing.
For the prediction above, we used public telecom data, cleaned it near perfection, trained and tested it and came out with a very high accuracy of 81%.
This accuracy goes down when your data is incomplete, not structured correctly, is a small sample size, or you don’t have enough attributes (or columns) to identify meaningful relationships.
This brings us to relationships.
Not the kind you have with your sourdough starter during quarantine, but the kind of relationships between attributes in your dataset.
To Define a Problem is to Define What Kind of Relationship You’re Looking For
Meaning, if you want to investigate why your customers are churning—like the prediction above—the main point of insight is going to be what attributes drive churn.

Here you can see that monthly charges are the top driver for churn.
This is how you should look at making machine learning predictions.
To put it simply, before you make a prediction, define the kind of problem you’re having and aim to identify what attributes might be causing that problem.
For example:
Business Problem: My customers are churning and I don’t know why.
Solution: Using data, I need to identify why customers are churning and what’s contributing to churn.
Now, you have a clear understanding of what data you need to solve this problem. You need detailed customer plan data such as their charges, type of service, demographic data, etc. Anything that can be possibly related to churn.
In the case of churn, you now know that monthly charges are directly related to why a customer churns.

Having a prediction report where you can explore attributes like this, gain significant insights, and have a model accuracy >70% is what a successful predictive model looks like.
If you’d like to read more about churn, click here. If you’d like to learn more about data collection, click here.
Structure Your Data and We Can Automate Preprocessing Tasks
When uploading a dataset to Obviously AI, it needs to have at least 1,000 rows and 5 columns.
Let’s call this the 1000 x 5 rule.
We have said in many tweets and blog posts that your dataset just needs to be structured, not necessarily cleaned to perfection.
As a refresher, here’s how we automate pre-processing tasks:
Once you press “Go” to make a prediction, Obviously AI begins the preprocessing phase where it essentially turns raw data into inputs the machine learning algorithm can understand. It removes rows or columns with empty/null values, feature columns with too many unique non-numeric values, upsamples and downsamples the data, and finally runs several other processes to make your data machine learning ready. This is also called Feature Engineering and is a popular ML term to improve ML model accuracy.
Obviously AI also performs normalization where it changes the values of the numerical columns to get more accurate ranges. Not every dataset requires normalization, but it is mainly used to improve accuracy when there are two very different ranges. Say for example, there’s a column of Age and a column of Salary. These columns will have two very different ranges. Age will primarily be number 0 to 100 and Salary could be anywhere between $40K to $1M. We don’t want the column with the larger range to influence the smaller range and make the prediction inaccurate, so we normalize the data and put it on a similar scale to Age.
If you wish to read more about how no-code algorithms work, click here.
How Should You Structure Your Dataset?
Obviously AI does very well with quantitative data. As of now, we do not support sentiment analysis or natural language processing. This is a common misconception people have about our platform. While this is something we’re working on, we make supervised machine learning predictions from tabular data very, very well. This is what we’re masters at.
Here are some examples of how to structure your dataset.

To start, you want an identifier column. This should be a unique user number. When making a prediction, you will use this as a way to separate your customers from one another. The user number should never repeat and doesn’t need to contain any personal identifiable information (PII) to be able to make meaningful predictions.

Next you want to make sure all rows in a column are the same format. It’s confusing to make sense out of your prediction report when some date rows are “1/1/20” format and some are in “January 1, 2020” format.
The same applies for all the rows. Before you make predictions with the dataset, you need to look over the dataset and make sure there are no repeating columns, incomplete rows, or too many empty cells.

If your dataset is going to make a bad prediction, Obviously AI will block it until the dataset is fit for prediction.
We also show a distribution of the dataset to let you know what areas need improvement.

What Does a Good Dataset Look Like
A great dataset has well above 1,000 rows and 5 columns so the machine learning can do what it does best: find relationships between attributes.
Using what we discussed in the last section, you should avoid repeated, empty, and false data before making a machine learning prediction that could influence your business decisions.
Here’s some examples of a great-looking dataset:

And another one:

If Your Model is Still Performing Poor, Consult a Data Scientist
We know this was supposed to be a DIY project, but sometimes you might need a little help. We offer a session with a dedicated Data Scientist to improve your model performance.
Don’t be afraid to ask for some help.
Read more about our dedicated Data Scientist here.


